Color-coded across criteria
Shade every parcel by use code, tax class, or value — and read the District like a heatmap.
Every SSL in the District — geocoded, color-coded across multiple criteria, and updated every night from official DC government data.
Ownership, ten years of tax history, and Street View on every lot, with tax-sale and lis-pendens overlays layered on top. All 128,000 parcels rendered live in WebGL.
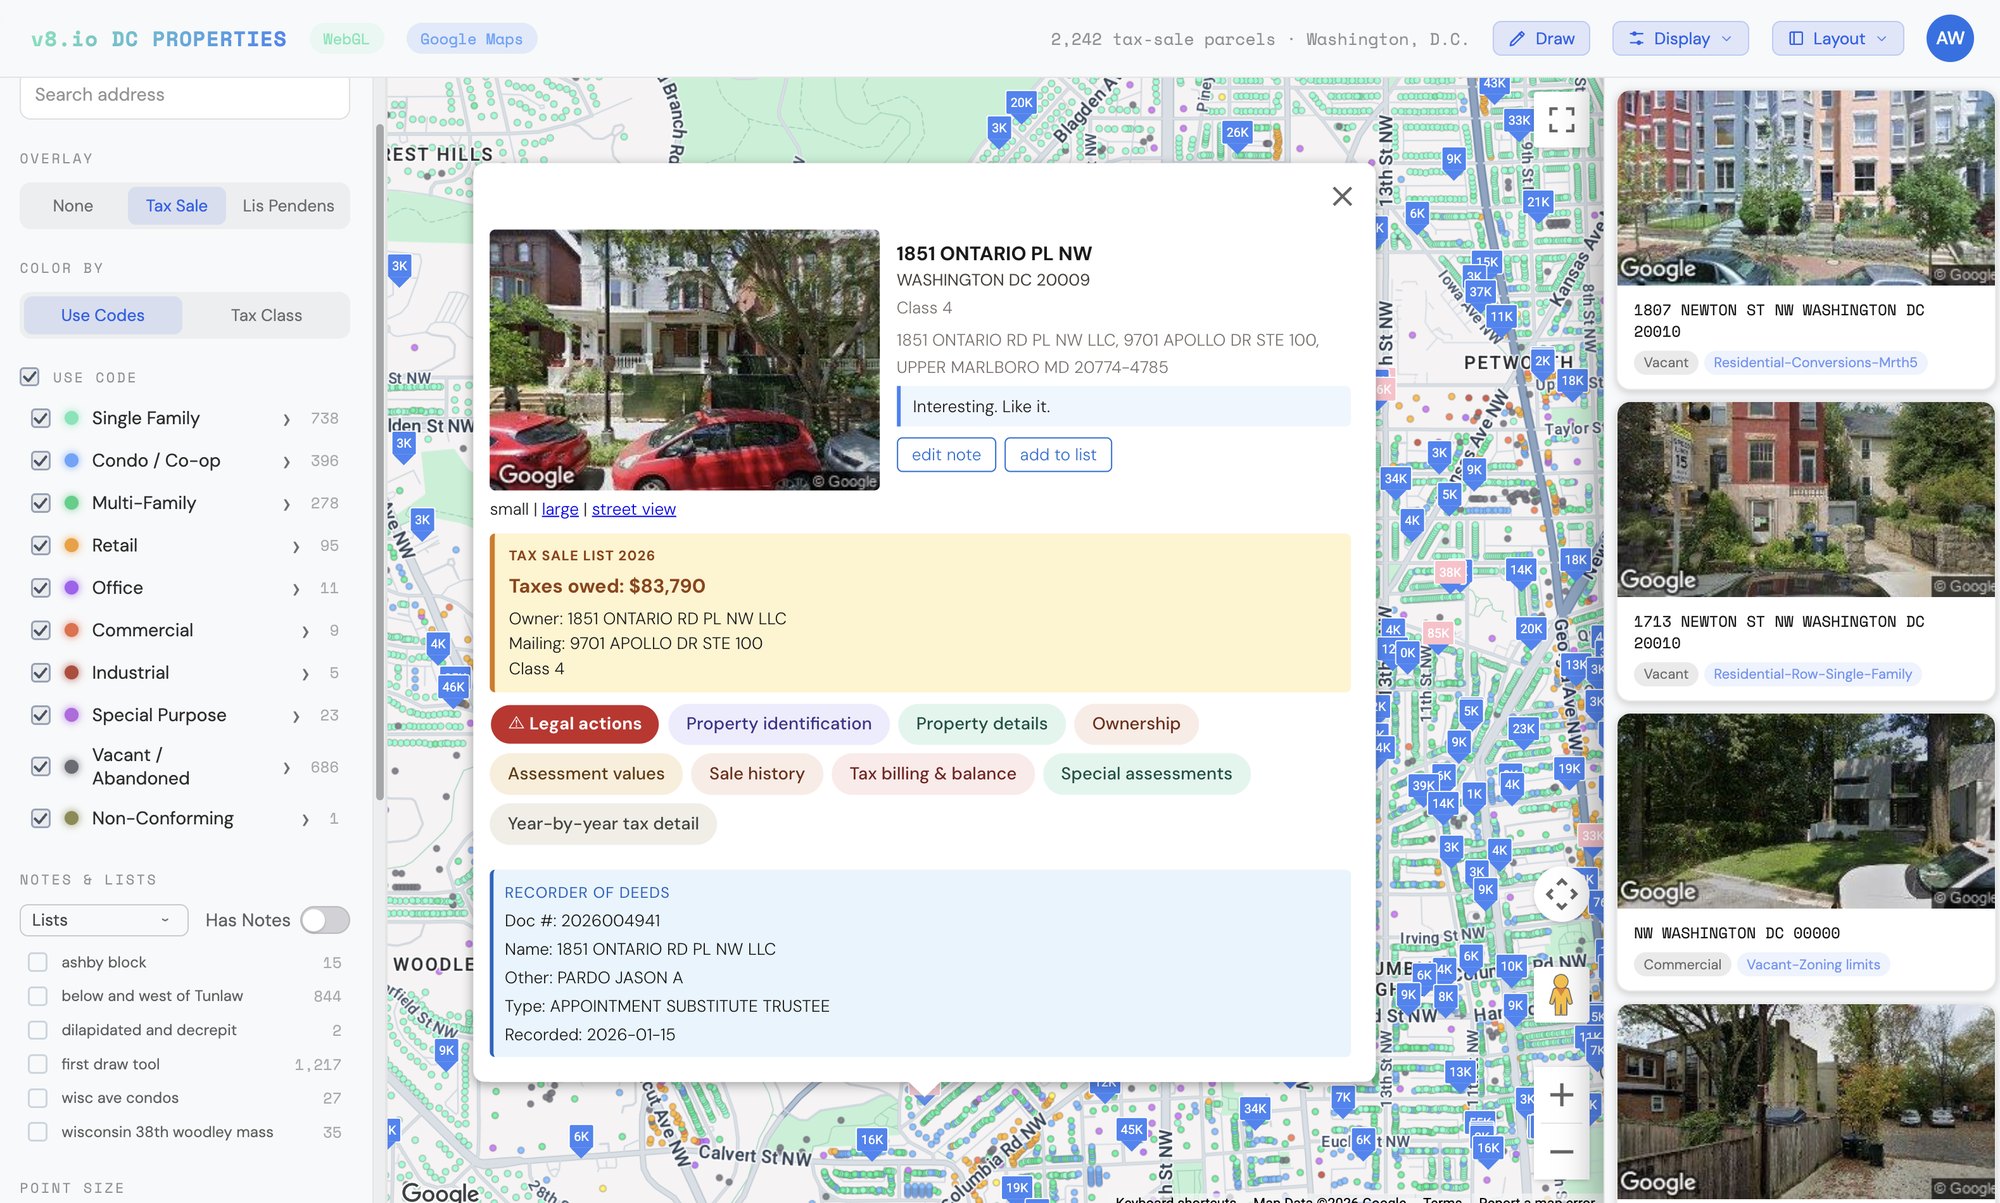
Every layer the District keeps on a property, pulled together and made navigable — instead of scattered across half a dozen government portals.
Shade every parcel by use code, tax class, or value — and read the District like a heatmap.
Build target lists and drop notes on any parcel. Your research lives on the map, not in a spreadsheet.
Full condo-regime detail — every unit tied to its parent lot, aggregated and navigable.
Toggle DCOZ zoning over any view to see what a parcel is — and what it could become.
Tax-sale and lis-pendens layers surface the parcels in trouble — often before they hit the market.
Who owns it, what they paid, and a decade of tax detail — plus Street View, on every parcel.
Open any parcel and read it the way a title or tax analyst would — year by year, line by line, straight from official DC data.
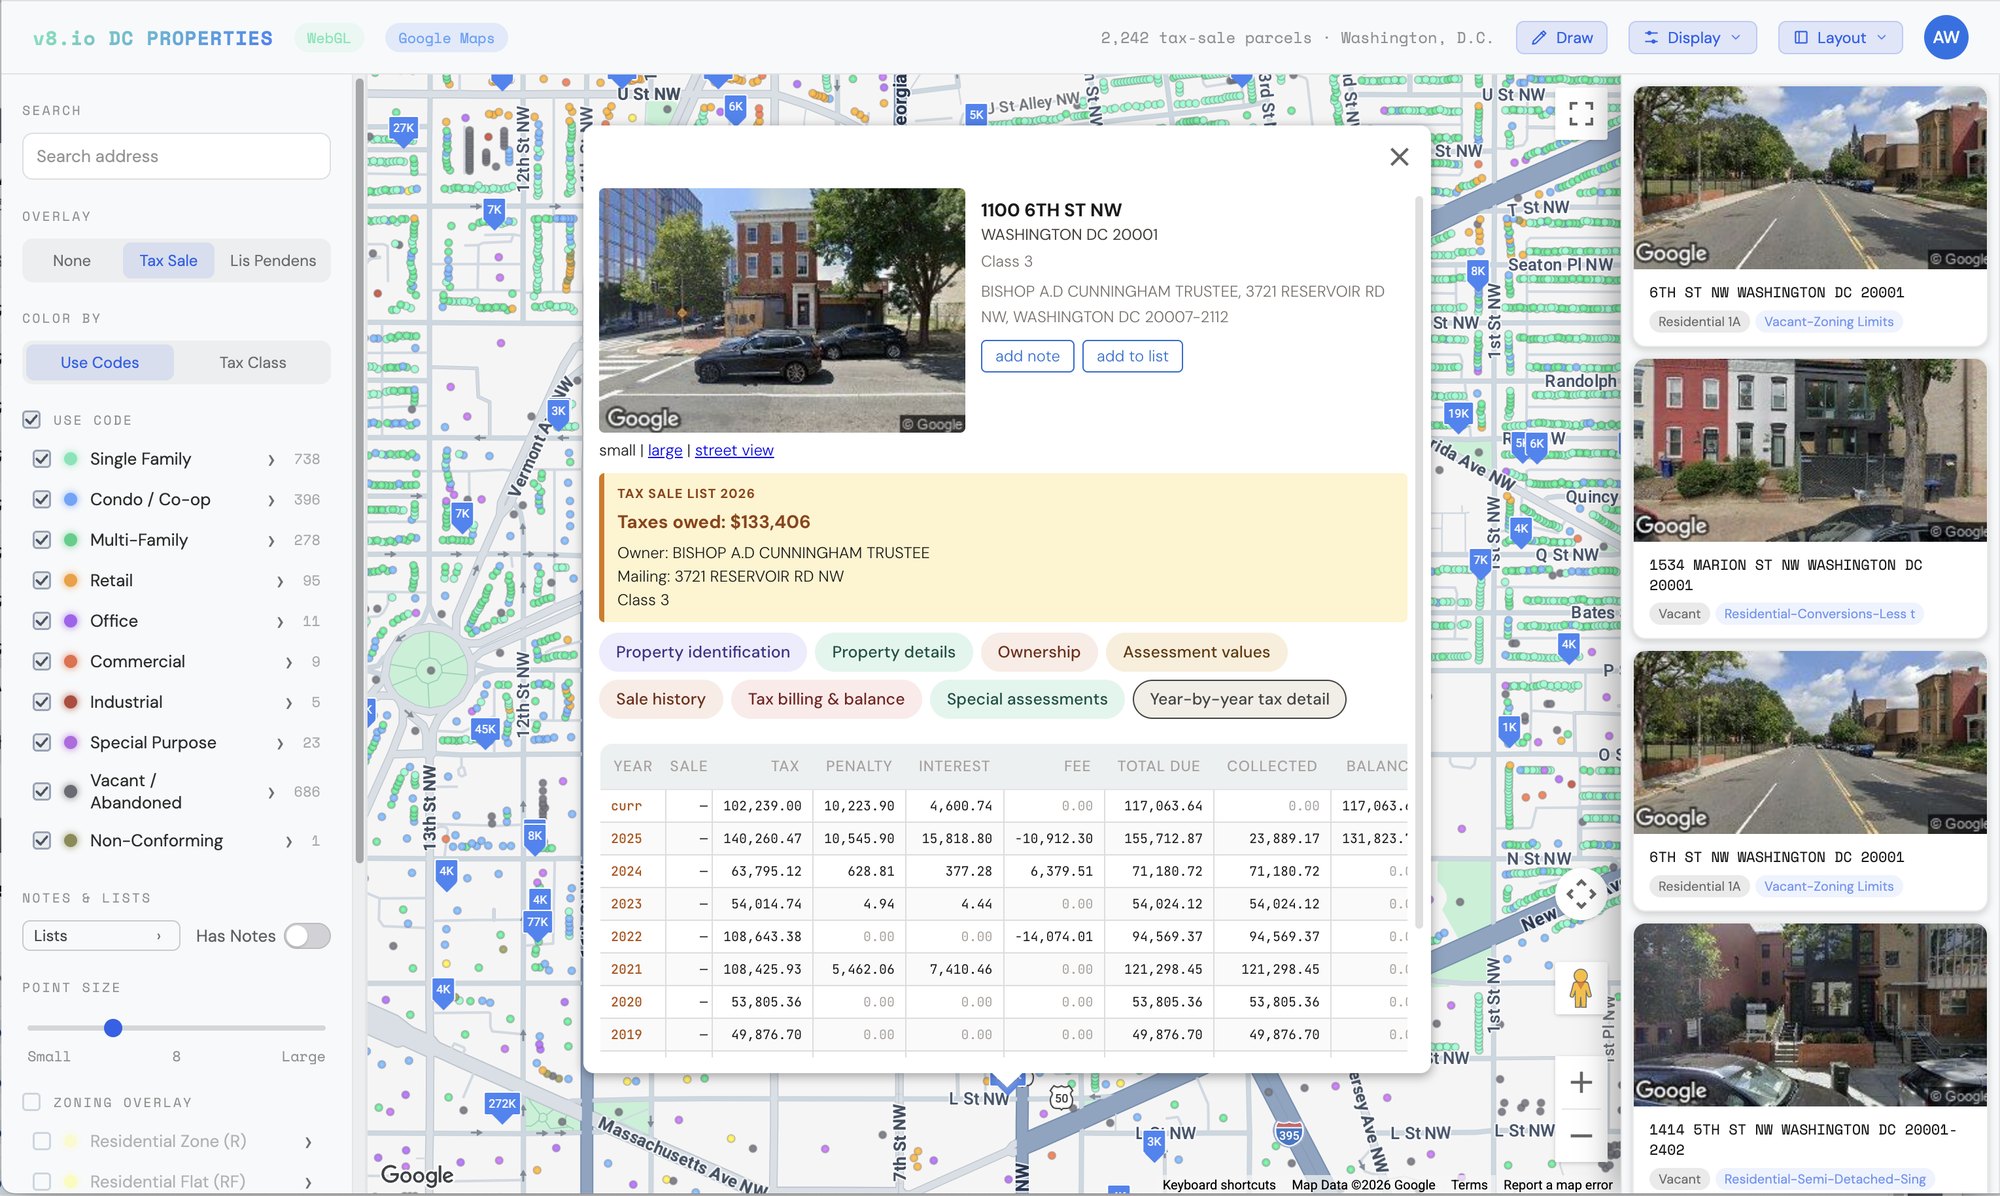
Ownership, tax history, condo regimes, zoning, and distress signals — sourced from official DC government data and rendered live.
Request invite